Dealing with Outliers
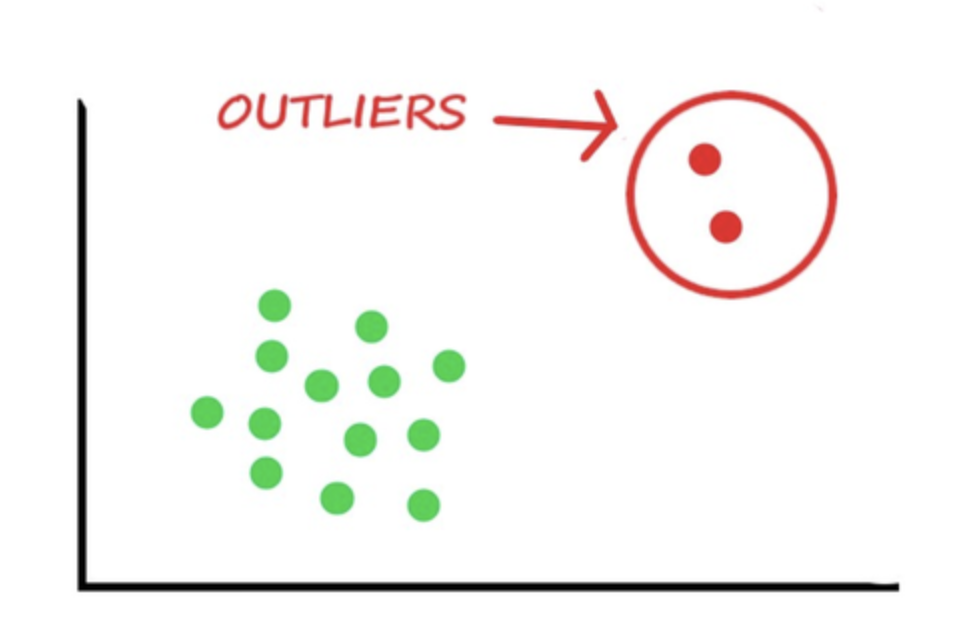
To find outliers in a dataset, we can visualize the data using scatterplots, boxplots, or histograms. Outliers can also be detected using statistical methods such as the Z-score or the interquartile range (IQR).
How to detect outliers
Z-score
- For a normal distribution with mean μ and standard deviation σ, the z-score for a value x in the dataset is given by:
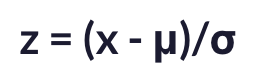 .
. - Under this transformation, if a data point lies outside [-3 (Lower limit), 3 (Upper limit)], then it is called an outlier.
Interquartile Range (IQR)
In statistics, interquartile range or IQR is a quantity that measures the difference between the first and the third quartiles in a given dataset.
- The first quartile is also called the one-fourth quartile or the 25% quartile.
- If
q25is the first quartile, it means 25% of the points in the dataset have values less thanq25. - The third quartile is also called the three-fourth or the 75% quartile.
- If
q75is the three-fourth quartile, 75% of the points have values less thanq75. - Using the above notations,
IQR = q75 - q25.
You can use the box plot, or the box and whisker plot, to explore the dataset and visualize the presence of outliers. The points that lie beyond the whiskers are detected as outliers.
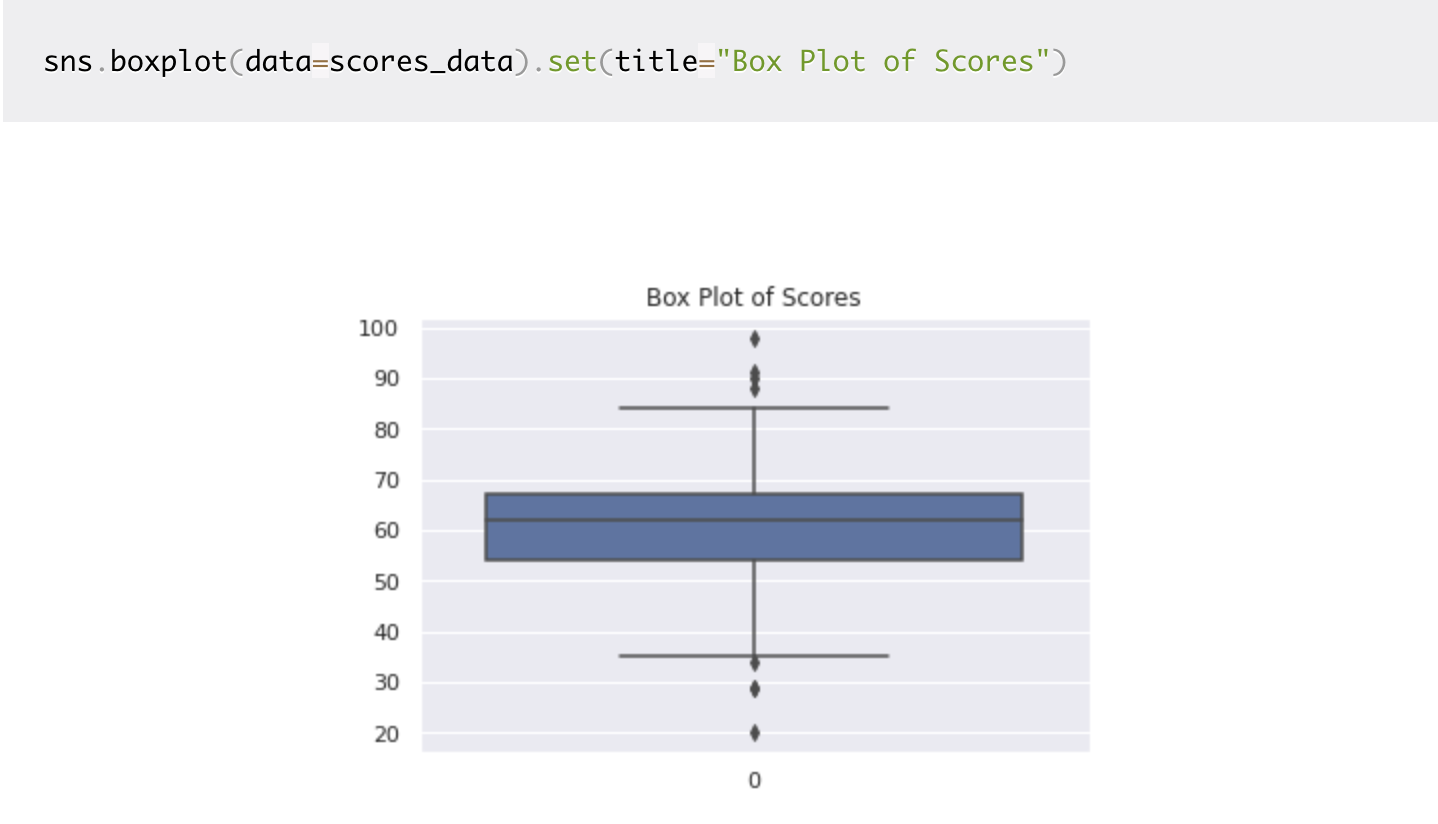
- The points that are outside the range
[q25 - 1.5*IQR, q75 + 1.5*IQR]are detected as outliers.
Here’s a summary:
- If the data or feature of interest is normally distributed, you may use standard deviation and z-score to label points that are farther than three standard deviations away from the mean as outliers.
- If the data is not normally distributed, you can use the interquartile range or percentage methods to detect outliers.
How to deal with outliers
Once outliers are detected, deciding what to do with them is important. Here are a few options:
- Remove them: Outliers can greatly impact the results of a machine learning model, so one option is to remove them from the dataset. However, this should only be done if the outliers are truly errors and not just unusual but legitimate values.
- Transform the data: Another option is to apply a transformation to the data, such as the log or square root, to reduce the impact of outliers.
- Impute missing values: If the outliers are missing values, then they can be imputed using methods such as mean imputation, median imputation, or regression imputation.
- Keep them: In some cases, outliers can provide important information and should not be removed. For example, in the Boston house prices dataset, a large house with many rooms may be considered an outlier, but it could also be a valuable data point that should be kept in the dataset.
The decision of what to do with outliers should be based on the goals of the analysis. It is always important to consider the reasons for the outliers and their impact on the results before deciding how to handle them.
Leave a comment